System Used:
Doppler Flow Velocity System
M-Series
Background
Coronary flow reserve (CFR) is an important indicator of coronary artery disease and specifically how the coronary arteries supplying the heart with blood are able to adapt to certain physiological conditions, such as exercising, aging, and normal stress. This protective mechanism allows the heart to respond to increased blood demand by increasing arterial vessel dimensions and the subsequent blood flow to the heart, called a hyperemic state. This hyperemic state can be induced via a vasodilator, exercise, or hypoxia 1–3 . In most cases, measuring the coronary flow velocity in one state, either baseline or a hyperemic state, is not sufficient; However, instead, both states are needed to measure coronary flow reserve capacity since coronary artery disease can be hidden under baseline conditions in many pathologies and is only uncovered when the heart is under physiological demand during this hyperemic state.
Methodology
Data was acquired using the Doppler Flow Velocity System (DFVS) from Indus. The DFVS is a high-frequency, real-time pulsed- Doppler measurement device with integrated data analysis software designed to measure blood flow velocity in small animals. A 20 MHz miniature handheld probe, shown in Figure 1A, was utilized. An enlarged image of the probe tip, spanning approximately 2mm in diameter is shown in Figure 1C, which gives a unique advantage over other ultrasound systems and allows for accurate alignment to blood flow with the probe. The rodent surgical monitoring system (RSM+) was used to monitor vital physiological parameters like ECG, respiration, and core body temperature – blood or ventricular pressures, as well as oxygen saturation (SpO2), can also be measured if needed for research.
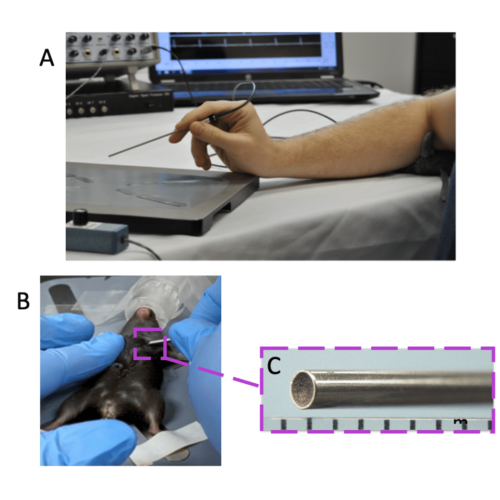
Figure 1. Overview of Doppler Flow Velocity System and Probe. A) typical system set-up for doppler flow velocity imaging, B) handheld probe orientation for coronary blood flow imaging, and C) the magnified inset of the probe tip.
The below methodology is a general protocol, and particular models or research goals may give reason to change specific parameters. In general, mice, rats, or other small rodents were anesthetized at an induction rate of 2 – Liter per minute and placed in the supine position onto the RSM+ platform. Once placed on the RSM+ platform, isoflurane levels were reduced to 1.5 – 2% for maintenance of anesthesia. ECG gel was placed on each limb and limbs were taped with surgical tissue tape onto the respective electrodes built into the platform. A rectal temperature probe was inserted to monitor core body temperature throughout imaging. It should be noted that deviation from physiological parameters can affect cardiac functioning in of itself, example: too much anesthetic or too cold of animal will naturally depress cardiac functioning, regardless of pathology. Some institutions prefer to keep these physiological parameters standardized between animals to ensure reproducibility of experiments and general good animal welfare practice, for example keeping heart rate at 450 ± 50 BPMs, core body temperature at 37ᵒC, etc.
For coronary flow, the probe tip should be placed on the skin near the chest area toward the anterior basal surface of the heart just below the left upper limb and held parallel (horizontal) to the animal platform surface. Bone will block out pulsed ultrasound, so will need to find a window through the 2 nd or 3 rd intercostal space on the left side of the animal, typical probe orientation shown in Figure 1B. *Note that small cardiac rotational differences in different animal strains and pathologies will slightly affect the probe orientation. For this type of imaging, it is recommended to use a micropositioner, a device built to hold the probe stable; small hand movements will cause loss of optimized imaging as shown by reduced signal intensity and reduced blood flow velocity peaks.
Depth range gate (sound penetration depth) should be set to 3 – 4 mm for mice. Depending on the size of the animal model chosen, this may need to be slightly adjusted.
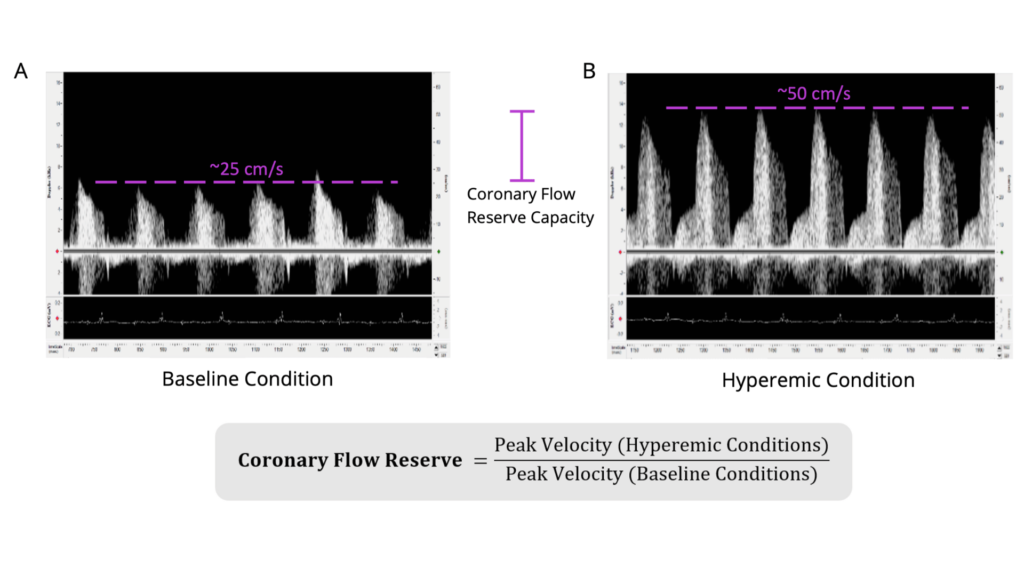
Figure 2. Coronary Flow Reserve Measurements and Imaging in Wildtype C57BL/6 Mouse. Shown is the A) coronary blood flow velocity at a physiologically baseline level (~1% isoflurane levels; peak blood flow velocity ~25cm/second) and the B) same blood flow at a hyperemic level (~2.5% isoflurane levels; peak blood flow velocity ~50cm/second). Scales are the same for both images (-15 to 65cm/sec). The equation to calculate coronary flow reserve is shown below (the CFR for this animal would be 2.0 in this example). Isoflurane was used as a vasodilator, but vasodilator of choice can be used. Electrocardiogram was recorded simultaneously to ensure appropriate timing of obtainment of blood flow signals and to determine heart rate. The left anterior descending artery was measured.
Once optimized Doppler image is found and probe is stabilized, lower isoflurane levels to 1% and save baseline data, an example is shown in Figure 2A. Increase isoflurane levels to 2.5%, or administer vasodilator, to get hyperemic condition, an example is shown in Figure 2B. For baseline imaging, set isoflurane levels flow rates to ~1% and for hyperemic conditions, set isoflurane levels to ~2.5%. Wait a few minutes between measures until there is a stable effect. Isoflurane quickly leaves the system and can be lowered and raised multiple times to get independent measurements, but other chosen vasodilators may not be feasible to image more than the baseline and hyperemic state one time. If rats are imaged, a vasodilator should be chosen since isoflurane doesn’t act as a vasodilator for these species.
Depending on the number of repeated measurements, the total acquisition time for this measurement is around 10 – 15 minutes. It should be noted that flow velocity can be measured in different vessels or along different segments of each vessel with each vessel having a characteristic blood flow velocity pattern and sound. Commonly measured vessels and their respective blood flow velocity are shown in Figure 3 with coronary blood flow velocity highlighted in purple.
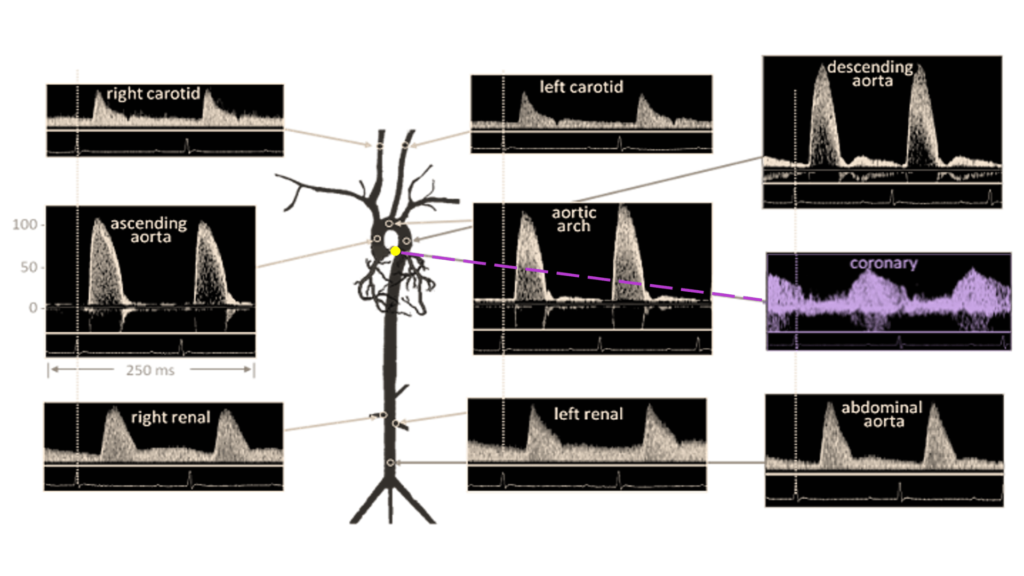
Figure 3. Doppler Signal from Mouse Aorta and Arteries. Velocities are similar in magnitude and shape to those from humans. Coronary blood flow velocity is highlighted in purple coloring. Diagram from Hartley et al., ILAR J 43:147-8, 2002.
Publication Highlights
Recent examples of how coronary flow reserve imaging has helped researchers answer important questions in their work. These publications used a similar protocol as the one stated, but there may be slight adaptations depending on their specific models and research needs.
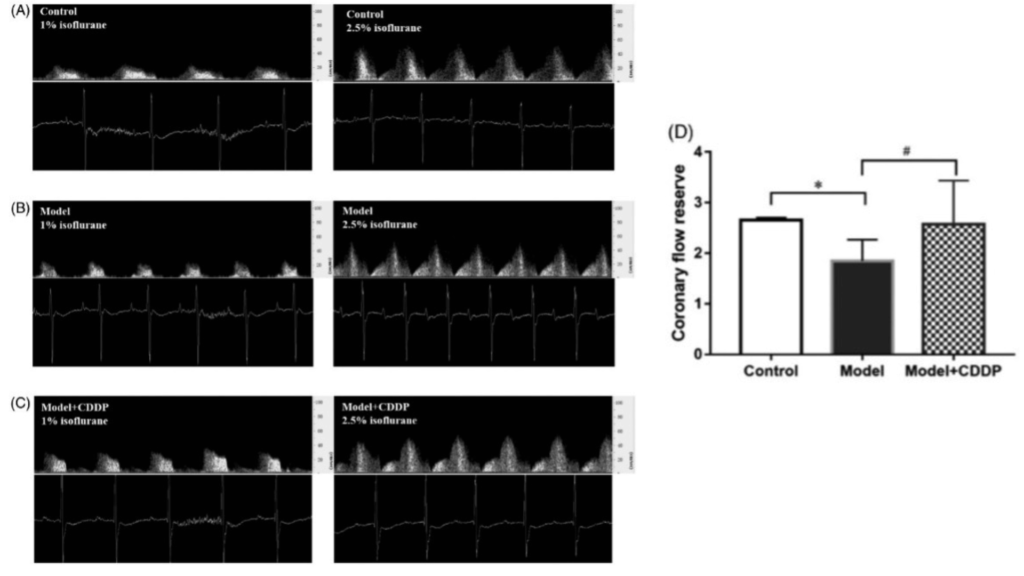
Publication 1. Pretreatment with compound Danshen dripping pills rescued coronary flow reserve capacity as compared to lipid infusion-induced microvascular dysfunction mouse model. Coronary flow velocity imaging during baseline (left image) and hyperemic (right) for A) control c mouse, B) lipid infusion-induced microvascular dysfunction mouse model, and C) lipid infusion-induced microvascular dysfunction mouse model pretreated with compound Danshen dripping pills with D) aggregated results. *p < 0.05, Data and images from Zhang et al., Pharmaceutical Biology 58:701 – 706, 2020 4.
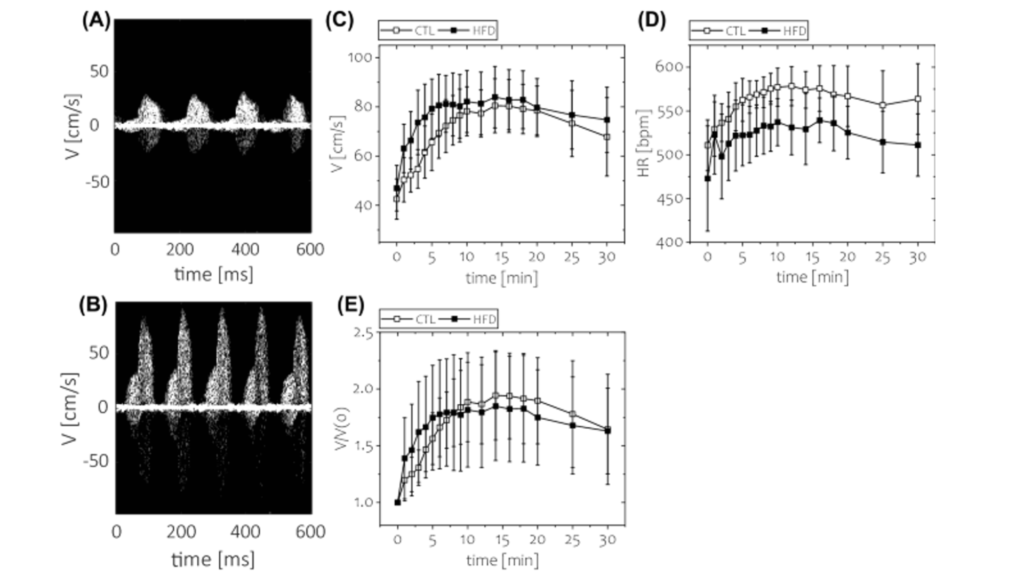
Publication 2. Short-term feeding of high fat diet (HFD) was not associated with impaired coronary flow reserve. Coronary flow velocity imaging during A) baseline and B) hyperemic (using regadenoson injection as vasodilator) conditions. Time course of C) absolute blood flow velocity, D) heart rate, E) coronary flow reserve. *p < 0.05, n = 8 animals for each group. Data and images from Kwiatkowski et al., Scientific Reports 11, 20215.
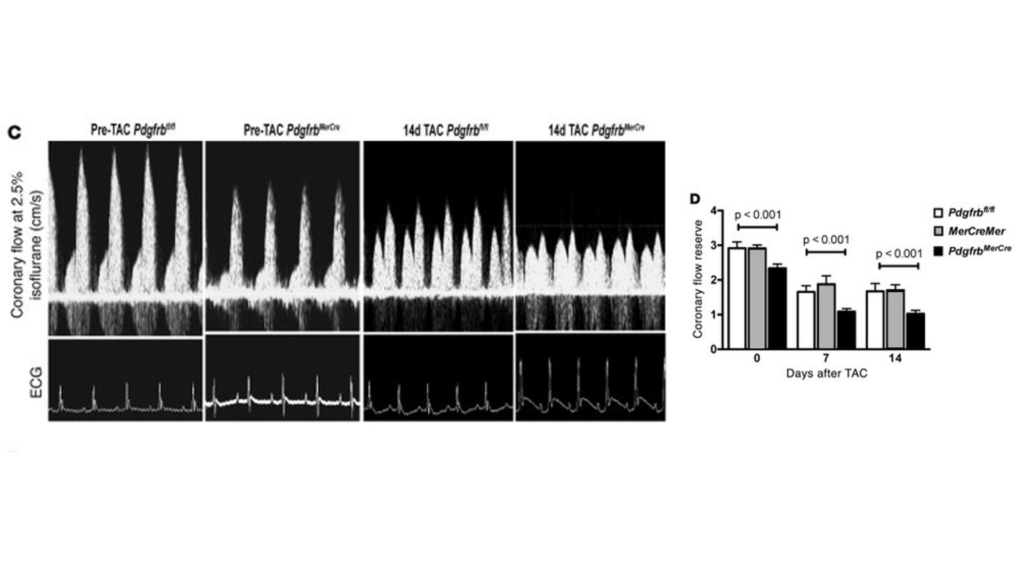
Publication 3. Pdgfrb knockout mice have reduced coronary flow reserve capacity as compared to controls after TAC surgery. (C) Representative ultrasound tracings of hyperemic coronary flow prior to TAC or 14 days after TAC in control Pdgfrbfl/fl or PdgfrbMerCre mice. (D) Quantification of CFR in Pdgfrbfl/fl, MerCreMer, or PdgfrbMerCre mice (n = 7 in each group at each time point). P values were determined by ANOVA, and significant differences between PdgfrbMerCre and control (Pdgfrbfl/fl and MerCreMer) mice were confirmed with Tukey’s test. Data and images from Chintalgattu et al., The Journal of Clinical Investigation 120, 20106.
References
1. Gould, K. L., Lipscomb, K. & Hamilton, G. W. Physiologic basis for assessing critical coronary stenosis: Instantaneous flow response and regional distribution during coronary hyperemia as measures of coronary flow reserve. American Journal of Cardiology 33, 87–94 (1974).
2. Wikström, J., Grönros, J., Bergström, G. & Gan, L. M. Functional and morphologic imaging of coronary atherosclerosis in living mice using high-resolution color Doppler echocardiography and ultrasound biomicroscopy. J Am Coll Cardiol 46, 720–727 (2005).
3. Shantouf, R. S. & Mehra, A. Coronary fractional flow reserve. American Journal of Roentgenology vol. 204 W261–W265 Preprint at https://doi.org/10.2214/AJR.14.13933 (2015).
4. Zhang, Y. et al. Pre-treatment with compound Danshen dripping pills prevents lipid infusion-induced microvascular dysfunction in mice. doi:10.1080/13880209.2020.1790619.
5. Kwiatkowski, G., Bar, A., Jasztal, A. & Chłopicki, S. MRI-based in vivo detection of coronary microvascular dysfunction before alterations in cardiac function induced by short-term high-fat diet in mice. Scientific Reports | 11, 18915 (123AD).
6. Chintalgattu, V. et al. Cardiomyocyte PDGFR-β signaling is an essential component of the mouse cardiac response to load-induced stress. J Clin Invest 120, (2010).