

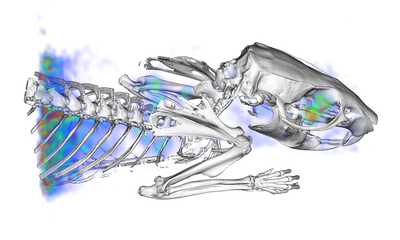


Preclinical Contrast Agents vs Clinical Agents in Small Animal Imaging
Preclinical Contrast Agents vs Clinical Agents in Small Animal Imaging Preclinical contrast agents

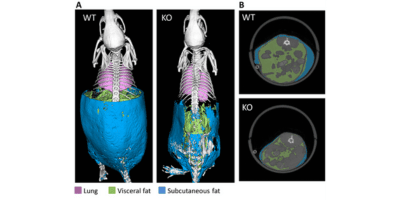
Imaging Body Composition in the GLP-1RA Era: Why MRI Adds Value Beyond DEXA
Unless you have been hibernating for the past few years, it has been

(May 16, 2024) M-finite applications of the M-Series (MRI)
(May 16, 2024) Webinar: M-finite applications of the M-Series (MRI) In this webinar,